The last time i posted a “what i work on” was almost exactly 2 years ago. And you know what? I’m working on the same thing: workbooks! but Workbooks has changed a ton since that last post.
Two years later…so much has changed!
Wait, first things first: what is “workbooks”?
A workbook is a canvas. The author can put all kinds of things in it that query data from various Azure data sources, present that data in interesting ways, arrange the layout to their liking, and configure how users can interact with them.
As users become more familiar with their data, the query languages, they can copy the workbook and customize it their own way and save it.
In general, workbooks is “monitoring focused”, but I like to say: “workbooks can’t do everything, but they can do almost anything.”
One big change is where workbooks appears.
Originally, workbooks was an Application Insights specific feature. Once the Application Insights and Operational Insights teams merged into just one team, the Log Analytics (now just known as “Logs”, abbreviated here as “LA”) feature of the portal was changed to use the same database backend as Application Insights, and the same data access APIs and services to query it. That allowed workbooks to query not only data from Application Insights resources, but also LA workspaces. Log Analytics can collect log and information across almost every kind of Azure resource and from other sources outside of Azure. So not only can you query AI and LA directly, but if you have Virtual Machines that are sending data to LA, you can also query the logs for that VM from a workbook. Then we added other data sources than just AI, and Log Analytics: Azure Alerts, Azure Resource Graph, health information, arbitrary JSON blocks, (and coming soon, Azure Data Explorer, things in Microsoft Graph, and arbitrary https endpoints!) Workbooks can also query metrics on Azure resources, so you can see charts or grids of any metrics data your resources are already producing, even if you aren’t using Logs.
So now workbooks appears in the Table of Contents for Azure Monitor, Application Insights, Azure Active Directory, and many other resource types, with more being added while i’m writing this.
Another big change is how workbooks appears.
When i last posted, you always got a default workbook you could customize, but you could also open workbooks you’d saved. But the initial experience was always a markdown step and a users step.
Today, when you open workbooks, you see a gallery of your most recent saved workbooks, and a set of templates you can use to create your own workbooks:
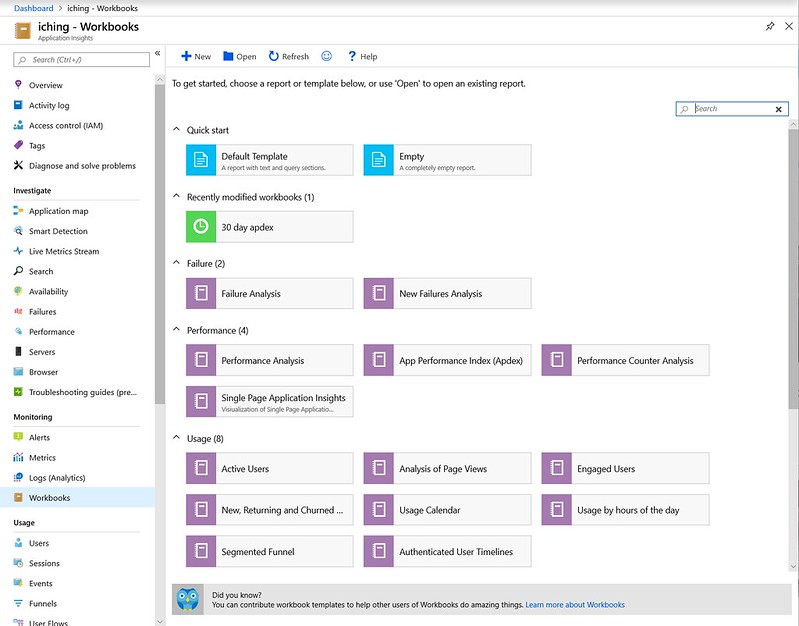
Figure 1: the workbook gallery
One of the cool things about the gallery is that text with the owl at the bottom: the templates shown in the gallery (the purple items) come from a public github repo! Workbooks themselves are a JSON file describing the steps and layout, and another file of information about what/where it should show, loc info, etc. If you look in the repo you can see all kinds of tools and features that are now using workbooks. The blue items in the gallery are “built in” templates that apply universally that let you quick start a workbook, like the “empty’ template. the green items are not templates, but are saved instances of workbooks that people have modified and customized and saved.
Another big change is how you interact with things in workbooks.
The last time i posted about workbooks, there wasn’t any interactivity. An author created the workbook where they set up all the steps and settings and filters and stuff, then they saved it. Others then opened it and looked at it. If you wanted to change anything, you had to go into edit mode in each step (there were always edit buttons everywhere!), and change the settings in that step, and then click “done editing” on the step to see what it looked like.
Today, a workbook is in “reading mode” or “edit mode”. In reading mode, most of the toolbar items disappear, the edit buttons disappear, and things are a lot less cluttered. In edit mode, an author sees all the edit buttons again, and can move things around and add more items.
 |
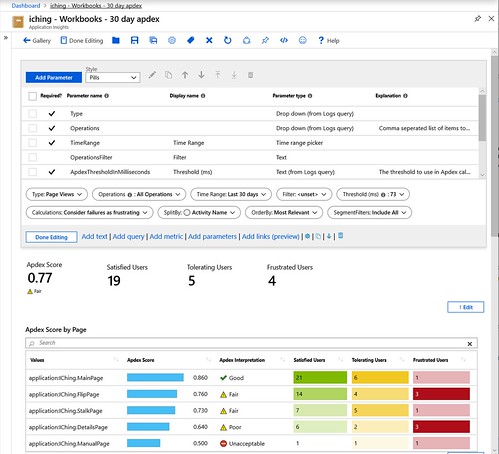 |
| Figure 2: reading mode | Figure 3: edit mode |
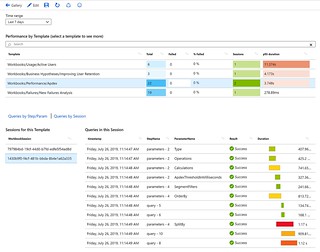
But probably the most interactive thing in workbooks are parameters.
Authors can make user configurable settings (we call them parameters), the values of which can be used in parameter markers in queries. This lets users change the behavior of a workbook without having to know how to edit queries or even ever see edit mode. Authors can use queries to create drop-down controls and text boxes that users can then interact with to further filter data, or change the way things look. Parameters can be used to control the visibility of sections of the workbook. Selections in charts and grids can also generate parameters to create “drill in” kinds of experiences. On time charts, time range brushing can be enabled to further filter other downstream charts to the same time range.
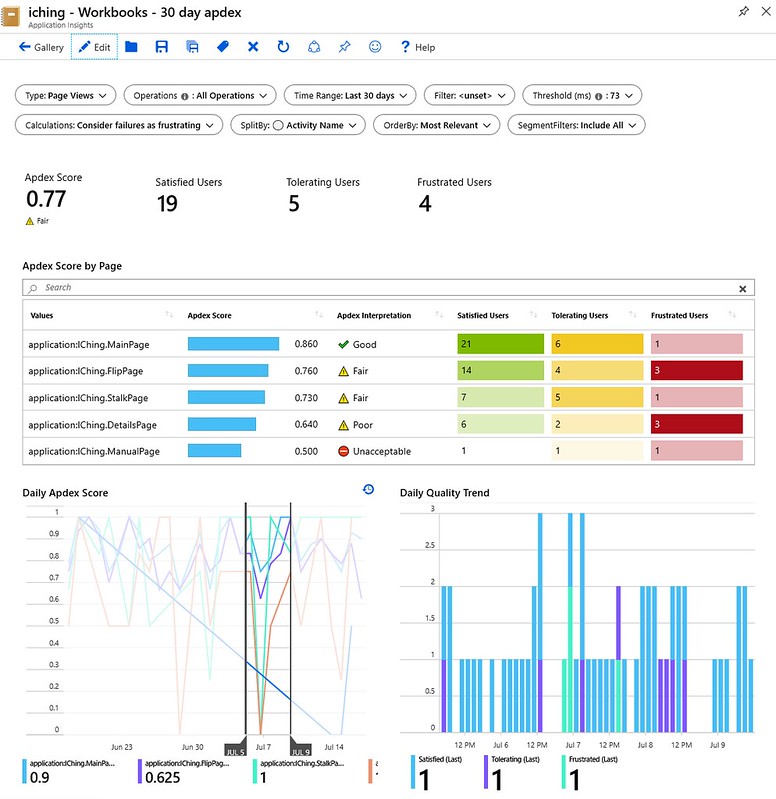
Figure 4: time brushing
The addition of parameters has totally changed what workbooks can do. Originally they were reports with preconfigured settings. With parameters, they can be full fledged interactive custom tools!
Probably the biggest change, though, is what data you can query, and the visualizations you can use to view that data.The generic query part of workbooks that was in its infancy in the last post is now the majority of the functionality of workbooks. The embedded usage tools were removed entirely, as they can be done as queries that are more customizable.
New data sources were added, and more are on the way.
Along with the data sources, the grid showing results of those queries now have tons of rendering settings to let you visualize the cells of the grids as heat-maps, bar charts, spark lines, timelines, icons, all kinds of things. Instead of grids you can use charts, tiles, graphs, and hive charts. Individual cells of all of those can link out to other views in Azure, or arbitrary urls, or other workbook templates.

Figure 5: heatmaps and sparklines

Figure 6: hive plot in a workbook. Super easy to find which VMs have high CPU at a glance
Predicting the past…
In the last post, i had a few bullet points about what might happen in workbooks in the future, and that future is now the past.
…we’re still trying to figure out what other Application Insights things to show inside a workbook, and now to clean up editing so you don’t need 100 gray edit buttons down the side, etc.
We mostly figured that out by removing the usage features and going just with Query, Metrics, Text, Parameters and Links steps in a workbook. Reading mode makes all the edit buttons go away, so that’s a lot better than it was. ✔ check!
…we’re trying to figure out a way to export the content and all the charts from the portal as a PDF or something, to make it easy to share…
On the export side, we’re still working with the portal team on some way of enabling exports. There’s no easy way to do that yet, unfortunately, so no check mark here.On the sharing side, we added an easy way to generate links to saved workbooks, and are working on making it easy to generate direct links to templates, so like a tiny ✔ check?.
…Investigating Azure Notebooks (and Jupyter Notebooks) as well…
For a while, we had an experimental feature that could export some kinds of workbooks to a Jupyter/Azure Notebook as python. But it was limited to only Application Insights, because the AI data access api had an easy way using API keys to retrieve data. Log Analytics never had that, so any generated notebooks needed to have a lot of extra generated code to do auth. I’m not entirely sure if there’s any easy way to query azure metrics from python, so those parts of a workbook wouldn’t work either. Parameters could kindof be exported, but only as variables that someone had type in python to change values. And generating all the charts and visualizations ended up being double or triple the amount of work, so the export to Jupyter code was all removed. I haven’t looked at Jupyter lately to see if that’s easier, but we’d really need a python expert to do a bunch of work there to help us out. And nobody from my team is a python expert. So that item is like a ✔check and an 〰 uncheck?
Predicting the future…
So what’s next in workbooks? A ton of stuff:
- More data sources (like Azure Data Explorer!)
- more visualizations (like maps!)
- more customization and style options (Things like layout settings and tabs are already in progress!)
- more integrations
- more templates
- hopefully the things i predicted last time that aren’t finished…

There’s always more to be done in workbooks!
And we need people to do that work! Do you want to come work on workbooks?
We’re hiring! See this posting: Software Engineer Redmond, Washington, or let me know if you are interested!

Leave a Reply