Recently, I’ve been working on Usage features for Application Insights in the Azure Portal. Our new usage features are still in preview mode, and include Users, Sessions, Events and Retention tools. A person would normally use them to look at how users use their websites or app, what they click on, how often they come back, etc.
Users Tool
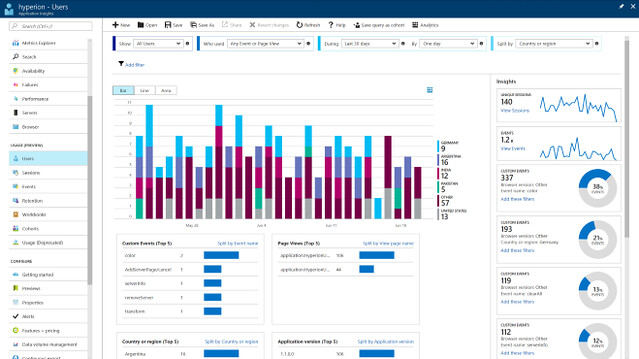
The users/sessions/events tools are very similar, showing you charts and grids and such about how users are using your website or app. You can filter and slice and dice and split, and save them and share them and pin them to dashboards and everything. (when you save them and pin them to the dashboard, they’ll show you a count matching your filters, so it’s possible to make a bunch of tiles on a dashboard that are like daily/weekly/monthly users of subsets of your site/app)
Retention Tool
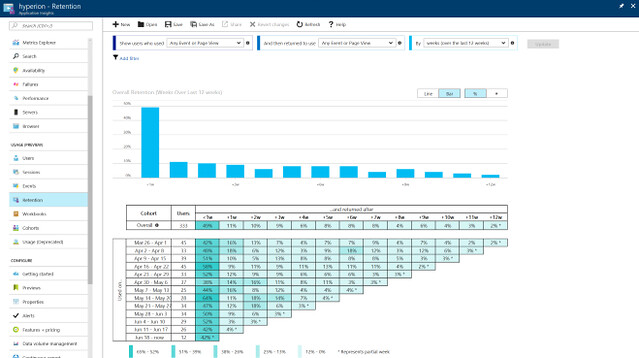
The retention tool lets you see how many people come back to your app after a certain amount of time.
Workbooks
The newest feature I’ve been working on is called Workbooks, and kind of allows you to merge all of those other tools into a single live “report”.
When you create a new workbook, it has a markdown text area as the first section, and a default users section next, just so there’s something there. You can add/move/remove/clone and put more markdown wherever you want. The users/sessions/events/retention charts get you some built in things pretty easily, and for pretty much everything else, you can harness the full power of analytics queries.
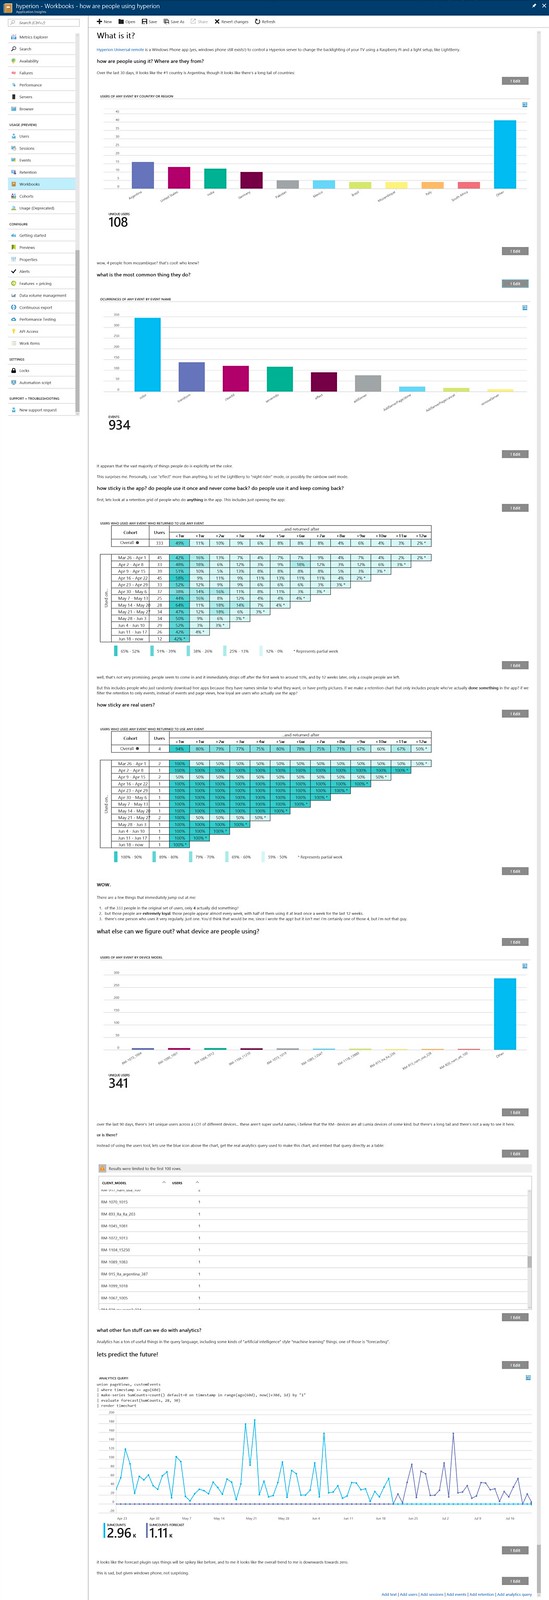
Here’s a big huge example one I made from data from one of my windows phone apps (yes, windows phone is still a thing! 🙂 )
It starts with users/events tools split by country or what event was most common, then looks at overall retention (in this case,☹), and retention of people who actually use something in the app (🙂 but ☹ since there’s only 4 of those users), then a chart of users by device type, then since there’s a long tail, an analytics query that gets the full list of those devices and their counts as a table, then fun with an analytics query that predicts the future by using evaluate forecast. Anyone else who could log into Azure and normally see any of this data can now see this beautiful report I’ve made, and it will show them live data, and they can clone it and modify it however they want.
Speaking of predicting the future…
There’s more to be done in workbooks.
- we’re still trying to figure out what other Application Insights things to show inside a workbook, and now to clean up editing so you don’t need 100 gray edit buttons down the side, etc.
- we’re trying to figure out a way to export the content and all the charts from the portal as a PDF or something, to make it easy to share, either to give to people who don’t have access to the portal, or to keep historical records for extended periods of time. Right now, there’s no good way to do that in the portal, you have to pretty much do what I did above, composite a bunch of screenshots, and trim out edit buttons. ☹
- I’ve been investigating Azure Notebooks (and Jupyter Notebooks) as well, and some way of exporting from here to there, so that you can turn a workbook like above into python code and /or do even more stuff there.
If you use Application Insights, try out workbooks (and all the other usage features, there are even more coming all the time, so you might find things that aren’t talked about here!), and if you have any feedback, drop me a line, either sending me email directly or by using the feedback tool in the Azure portal!

Very nice! Great work! Looking forward for the oppurtunity to export to pdf. Best Regards