In the last “what I work on” post, I talked about the Code Map feature that was new in Visual Studio 2012 Ultimate (Update 1). It has turned out to be a very popular feature (as it should) because it is super useful!
After people have used Code Map for a while, one of their first requests is “how do I get debugger information into this map?” There are ways to do it, where as you step through code, you keep manually doing “show on code map” on the method you’re in, but that gets very tedious.
So, for Update 2 (now available!) we added debugger integration to Code Map! To see it in action, you can watch this channel 9 video, or update today and play with it yourself!
Here’s a screenshot of it in action, debugging a Windows 8 Store C# app:
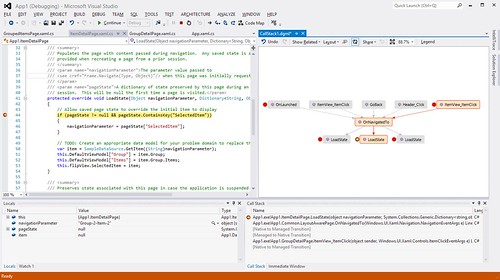
When debugging the “old” way, you have to watch both the editor window and the call stack window, step in or out or whatever, and try to mentally figure out what is still on the stack, which commonly ends up in “where am I now?” or “how in the world did I get here?” kinds of issues. And then, as soon as you stop debugging, the call stack window goes away, and if you were stepping through code that you don’t have open (so it was open in VS’s preview tab), then most of the files you stepped through aren’t open in the editor anymore! I know that I end up copying the call stack, and pasting it into notepad so I can remember where I was. Or, if I’m trying to correlate multiple call stacks, I paste them into columns in an excel spreadsheet, then do a lot of excel work to line things up to figure out what is the same.
Instead of all that… debugging the “new” way with the code map debugger integration gives you a nice little treasure map of where you’ve been (gray nodes), where you are (the standard call stack arrow, visible in the map, the editor, and the call stack window), and everything that is currently on the stack (orange nodes). As you hit breakpoints or step around in code, the map updates to add whatever is on the stack at that point in time. And when you stop debugging (and the stack window goes away!), the map is still there, and still functional!
You can see in the picture above, I was doing “shotgun” debugging, where I just scattered breakpoints around the code, to see who calls what. In the old way, you’d have to mentally figure out that almost every call in the app ends up going through one method, with a giant name in the call stack window, like:
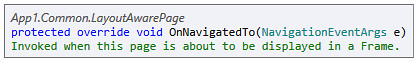
App1.exe!App1.Common.LayoutAwarePage.OnNavigatedTo(Windows.UI.Xaml.Navigation.NavigationEventArgs e) Line 332 C#
which certainly is a mouthful. instead, in the graph, you can see it as a single node, you instantly see that everything we put breakpoints in goes through it somehow, and if you mouse over it:
From both the graph and the stack window, you can double click and go right to that code. But, from the graph, you now have all the other powers of Code Map at your disposal. Want to see what types all the methods are in? Who derives from what? just use the “show related items” menu in the code map toolbar, or right click and do stuff from there:
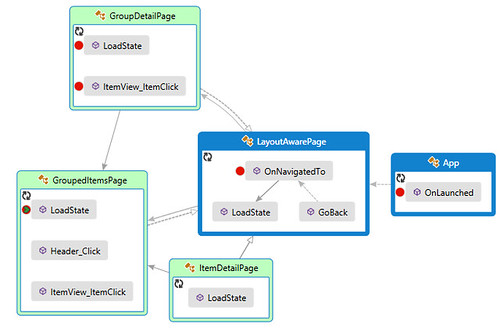
I did several steps to get to this diagram, by clicking the “LoadState” item in the first graph, and doing “find references”, which added 3 LoadState overloads from other classes. Then, I selected everything and did “show containing type”, which added the groups. Then I did “show derived types” on LayoutAwarePage, showing that 3 things on the graph are green, indicating they are the types that are subclasses of LayoutAwarePage.
One of the fun things about the debugger integration is that almost every language that VS supports has really good debugger integration, because debugging is essential. Not every language integration implements the things that Code Map needs to be super effective. So if the debugger works for a language, the map part of the debugger should work. Want to see how your old school C++ Win32 app works? Put in some breakpoints, and generate a map, and poof:
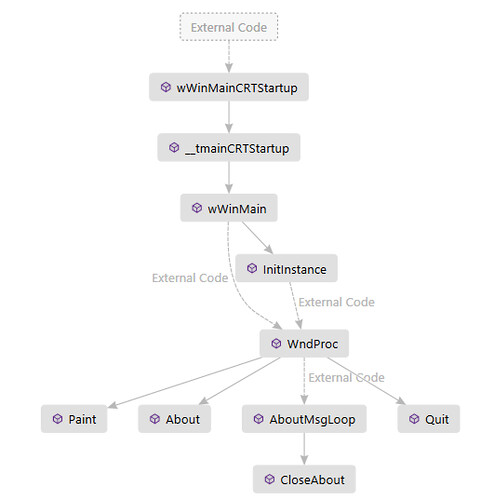
Want to see how your old school c++ Win32 app really works? in the call stack window, right click and select “show external code”, then generate that graph again:
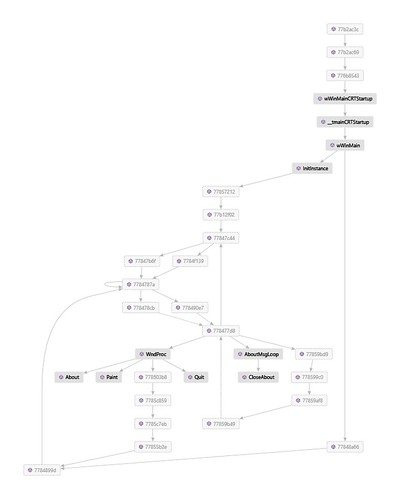
In the first graph, all the items outside your solution end up being elided, and just show up as dashed links with “External Code” labels. With “show externals” turned on, code map creates an individual node for everything that shows up in the call stack window, with a faded out look. If the external assemblies have debug information the debugger can see, they’ll have somewhat useful names, but if you don’t have debug info for those assemblies, you just get addresses, but you still see the relationships! you can see that Win32 has a lot of loops!

Leave a Reply